
Is Argenx SE (ARGX) a good stock to buy?
Nothing we have tested argues against it, and one check argues for it.
What each rating means, in numbers
Business quality — Middling. Passes 5 of the 8 health checks we can measure — things like making a profit, turning it into cash, and not piling on debt. Across 131,000 company-quarters the weakest scorers went on to fail at 5.4% against 1.4% for the strongest, in every era and all twelve sectors.
How wild is the price? — Calm. The share price swings about 30% in a typical year, which puts it in the below average. Out of every 100 companies that swung like this, about 0.7 went bankrupt within the year. Across the three periods we tested that ran from 0.0% to 1.6%.
What "tested" means here, and why there is no score out of 100
Tested means the read was measured against what actually happened afterwards, on a history that keeps the companies that were later delisted, using only figures that had been filed on the day they are used. Survival was ranked on companies that really did fail. What an owner keeps was tested across the universe from 2011 to 2025.
The full record of everything we have tested is on the research pages.
Which benchmark. Over the period we tested, the median listed company returned +5.8% a year while the S&P 500 returned about +13.9% — the index is weighted by size and was carried by a handful of enormous winners. So "beats the index" and "beats the other companies you could have bought" are different questions. Where a read says it picks better companies, it means the second one. None of these gets you an index fund's return, and we would rather say that than imply otherwise.
The quality read is the strongest thing we have tested: 131,000 company-quarters across 5,300 companies, where the weakest scorers went on to fail at 5.4% against 1.4% for the strongest, holding in every era and all twelve sectors. It still says less likely to break, not likely to beat the market — every band in that study lost to the index at the median, because the median listed company does.
Each read is shown on its own rather than merged into a single score, so you can see which part is strong and which is weak instead of taking an average on trust.
▾ What goes into the smart-money reading
Contributions (weight × component score) sum to the total. This near-term score now includes fundamental health (leverage, FCF trend, DCF applicability). It excludes the Altman Z score, whose retained-earnings input this filer does not report separately. See the Financial Health section for the full balance-sheet read.
Chance the S&P 500 falls 10% or more in the next three months.
Counted from every day since 2006. Says nothing about ARGX — see the board for how it is measured.
📍 Where to start on this page, and what to look at first
How to read ARGX (pre-profit growth)
ARGX generates real cash flow, but the DCF here is a low-confidence estimate — the value is sensitive to how we normalize cash flow, cyclicality, and secular/industry risk. Treat the DCF as one input, then pressure-test it against the reverse-DCF, leverage, and the operating trends below.
-
1
Reverse-DCF — the growth the price demands ↓
It shows exactly how fast the business must grow to justify today's price. Compare that to what comparable companies have actually achieved.
-
2
Cash runway ↓
Can it reach profitability before it has to raise money and dilute shareholders?
-
3
Interactive calculator ↓
Set your own growth + margin assumptions and see what the business would be worth if you are right.
Is Argenx SE (ARGX) overvalued?
Macro: no macro dataYes, by our measure: the price is about 282% above what we think the business is worth.
ARGX trades at $818.30 vs an estimated intrinsic value of $213.97 — a +282.4% premium to model IV.
Not investment advice. The model can be wrong. Verify the assumptions in the sections below and consider consulting a licensed advisor for significant decisions.
What return would ARGX pay as a bond?
Not measurable here. Pre-profit: the coupon is projected, not earned. An equity bond needs a coupon that exists today. See the cross-company ranking →
What growth must the market believe? Reverse DCF — Instead of asking "what is this stock worth?", asks "what growth rate is the current market price already assuming?"
Why it matters: It crystallizes the bull thesis as a single number you can argue with. If the market expects 40% growth for 10 years and you do not believe that, the stock is overvalued.
Reference: 10–15% = sustainable for strong companies · 20–25% = exceptional · 30%+ = historically very rare
Traditional DCF asks "what is this stock worth?" Reverse DCF flips it: it treats today's price as correct and solves for the growth rate that justifies it. In plain terms — if our model is right about everything else, the company's cash flow would have to grow (or shrink) by this much every year for the next 5 years for today's price to make sense. If that required growth looks unrealistic, the price is stretched; if it looks easy to beat, the price may be cheap.
Why it matters: A company can show big profits on paper while burning through cash. FCF is what actually fills the bank account.
Reference: Healthy mature businesses convert 8–15% of revenue into FCF · Growth companies often negative
Full explanation → must grow at:
▾ Exactly how this 5-year figure is computed
Forecast length: 5 years at the solved rate, then a linear fade to terminal growth over years 6-10 — the same shape the DCF above uses
Terminal growth after the fade: 3.0%
Discount rate: 9.5% (the rate the model used)
Price used: $818.30 — the live price shown on this page (not frozen)
Method: solve for the constant annual growth rate that makes the discounted 10-year FCF stream + terminal value equal today's price.
An above-average expectation for five years. Achievable for a genuinely strong business that executes well.
For reference: Exceptional is not a compliment here — sustaining mid-teens cash-flow growth for ten straight years is rare at scale. The price is betting on a top-tier outcome.
▾ How we computed this · Reality check thresholds · Assumptions
- Starting FCF/share: $21.82 (projected from revenue × terminal margin)
- Discount RateDiscount Rate — The annual return you demand for taking single-stock risk instead of buying a safe Treasury or index fund.
Why it matters: Higher discount rate = stricter valuation (a stock has to produce more cash to be worth holding). Lower = more generous.
Reference: 8–12% is standard · 9–10% matches S&P 500 historical return · Below 7% is illogical for single-stock risk
Full explanation →: 9.5% — standard 8-12%; 9-10% matches S&P 500 historical return - Terminal Growth RateTerminal Growth Rate — The growth rate we assume the company holds forever, after the explicit 10-year forecast period ends.
Why it matters: It anchors the long-tail value. Cannot mathematically exceed long-term GDP growth or the company eventually becomes larger than the global economy.
Reference: 2–3% (matches long-term US GDP growth) · Above 4% is mathematically problematic
Full explanation →: 3.0% — matches long-term GDP growth - Forecast horizon: 10 years explicit + terminal perpetuity
| ≤ 0% | Priced for decline — likely undervalued OR dying business |
| 5-12% | Reasonable; sustainable for quality businesses |
| 12-18% | Demanding — strong execution required |
| 18-25% | Exceptional — few companies sustain for a decade |
| 25-35% | Heroic — historically very rare |
| 35%+ | Borderline impossible at scale |
Sustaining 30%+ cash-flow growth for a full decade at scale is exceedingly rare — the bar is brutally high.
Use the interactive calculator below to change the discount rate, growth and terminal-growth assumptions and watch the value move.
What this rating means
What the rating says — Methods disagree. Methods disagree: the price is ABOVE 1 of 3 method ranges while inside the rest — assumption-sensitive, not clearly fair.
What it does not say — Not a forecast. This shows where today's price sits against several different ways of valuing the business. Where the methods disagree, the spread itself is the useful part - it tells you how much the answer depends on which one you trust.
Football field: where does the price sit?
Different valuation methods produce different fair-value ranges depending on assumptions. Plotting them together lets you see at a glance whether the current price is reasonable across approaches, or only one specific lens.
Industry multiples sourced from: industry: Biotechnology. See the Peer Basket section below for the peer comparison and its limited-comparables caveat.
How does ARGX stack up against its closest peers?
We take the 8 same- or closely-related-industry companies closest in size to ARGX and check what investors are paying for each dollar of their revenue (or profits). If ARGX is much more expensive on the same yardstick, that's a red flag — unless you have a specific reason it deserves a premium. For a leveraged business, EV/EBIT and FCF yield (both in the table) are usually more reliable than EV/Sales, because revenue multiples ignore differences in margins and debt.
▾ What's "EV / Sales" in plain English?
EV (Enterprise Value) = market cap + total debt − cash. It's "what you'd pay to buy the entire company outright" — you pay the market cap to shareholders and take over their debt, but you keep their cash. EV is fairer than market cap alone because it includes the debt the new owner inherits.
EV / Sales = EV ÷ annual revenue. So "2.5×" means investors pay $2.50 of enterprise value per $1 of yearly sales. Higher = market is paying more per dollar of sales (usually because they expect future growth or fat margins).
p25 / median / p75 are the 25th, 50th (middle), and 75th percentile of the peers' multiples. Half the peers fall between p25 and p75. The median (p50) is the typical peer — that's the benchmark we compare to.
| EV / SalesEV / Sales — For every $1 of yearly revenue, this is how many dollars investors pay to own the whole business (including debt). Why it matters: Works for pre-profit growth companies where P/E and FCF don't apply. The most apples-to-apples cross-company multiple because it ignores accounting choices. Reference: 1–3x for mature companies · 4–10x for software/SaaS · 10–20x for hypergrowth · >20x is rare and demanding Full explanation → |
5.3x / 7.9x / 23.4x |
| EV / EBITEV / EBITDA — Enterprise value divided by earnings before interest, tax, depreciation, and amortization. Why it matters: A classic "what would a private buyer pay" multiple — used in M&A. Strips out tax and capital-structure noise. Reference: 8–12x for mature businesses · 15–25x for growth · Below 5x often signals distress Full explanation → |
23.9x / 25.7x / 56.5x |
Bold middle number = median peer. Half the peers trade above it, half below. Computed over 8 same-industry peers; implausible multiples excluded.
⚠️ Important caveat: peer multiples only work if the peers are genuinely comparable. Always check the peer list below — if the auto-picker grabbed micro-caps or unrelated businesses, the comparison is noise. A medical-device giant priced against tiny biotech startups won't produce a useful signal.
▾ View peer list (8)
| Ticker | Company | Industry | Mcap | EV/Sales | EV/GP | EV/EBIT | FCF Yield |
|---|---|---|---|---|---|---|---|
| RVMD | Revolution Medicines, Inc. | Biotechnology | $33.5B | — | — | — | — |
| NBIX | NEUROCRINE BIOSCIENCES INC | Biotechnology | $15.9B | 5.6x | — | 25.7x | 3.3% |
| QGEN | QIAGEN N.V. | Biotechnology | $9.5B | 5.3x | 8.6x | 23.9x | 4.2% |
| KRYS | Krystal Biotech, Inc. | Biotechnology | $9.1B | 23.4x | — | 56.5x | 1.5% |
| PCVX | Vaxcyte, Inc. | Biotechnology | $7.4B | — | — | — | — |
| RGEN | REPLIGEN CORP | Biotechnology | $7.0B | 10.2x | — | 136.6x | 1,472.7% |
| KYMR | Kymera Therapeutics, Inc. | Biotechnology | $6.7B | 170.8x | — | — | 0.0% |
| SRRK | Scholar Rock Holding Corp | Biotechnology | $5.9B | — | — | — | — |
Quality & solvency checks
Cheap stocks can be cheap for a reason. These screens warn when a low valuation comes paired with structural fragility.
What these health ratings mean, in numbers
Business quality — Middling. Passes 5 of the 8 health checks we can measure — things like making a profit, turning it into cash, and not piling on debt. Across 131,000 company-quarters the weakest scorers went on to fail at 5.4% within a year against 1.4% for the strongest, and that held in every era and all twelve sectors. It says "less likely to break", not "likely to beat the market".
Why it matters: Cheap-looking stocks (low P/E or P/B) often have low Z-scores because the market knows the company is dying. Z-score warns you before you fall into a value trap.
Reference: > 3.0 = safe zone · 1.81–3.0 = grey zone · < 1.81 = distress zone
Full explanation →
We can't produce a trustworthy Altman Z here: retained earnings weren't separately reported in our data, so a core input would have to be fabricated. Rather than show a categorical "distress" verdict from an invented number, we mark it unavailable. Judge financial health from the leverage, cash position, and the measurable Piotroski checks instead.
▾ The checks — what passed, what didn't (and what we couldn't measure)
-
✓ Positive net incomeNet income $1,292.0M in FY2025.
-
✓ Positive operating cash flowOperating cash flow $685.2M (was -$82.7M the prior year).
-
✗ Cash flow backs up reported profitOperating cash flow $685.2M vs net income $1,292.0M.Why this matters: When cash generated exceeds reported earnings, profits are high-quality (not propped up by accruals or one-time items).
-
✓ Return on assets improvingReturn on assets 14.9% vs 13.4% a year ago.
-
✓ Debt load (vs assets)The filing reports no interest-bearing debt in either year (total assets $8,682.7M).
-
✗ Short-term liquidity (current ratio)Current ratio 5.23x vs 7.29x a year ago.Why this matters: The current ratio compares assets it can turn to cash within a year against bills due within a year. Below 1.0 means it may struggle to cover near-term obligations.
-
✗ Share count (dilution)Share count rose 2.4% (59.9M → 61.3M year-over-year).Why this matters: Issuing lots of new shares splits the pie into more pieces, shrinking your slice. Stable or falling share count protects existing owners.
-
· Pricing power (gross margin) (n/a — data not reported; not scored)
-
✓ Sales per asset (asset turnover)Asset turnover 0.48x vs 0.35x a year ago.
Missing data is never counted as a pass or a fail — it's shown as n/a and excluded from the denominator. Each check compares the company against its own prior year.
What if you assume different inputs?
Here's where we land — and what happens if you change the assumptions. Drag the sliders to set your own Discount RateDiscount Rate — The annual return you demand for taking single-stock risk instead of buying a safe Treasury or index fund.
Why it matters: Higher discount rate = stricter valuation (a stock has to produce more cash to be worth holding). Lower = more generous.
Reference: 8–12% is standard · 9–10% matches S&P 500 historical return · Below 7% is illogical for single-stock risk
Full explanation → (the annual return you demand for single-stock risk) and terminal growth; the value updates live so you can see whether the stock looks cheaper or richer. The discount rate starts at 9.5%, the figure our model used for ARGX. Open Advanced to also change beta, growth and the rate path.
Note: the calculator opens at our published value of $213.97 — it is initialised to the same scenario-weighted result, so the two match exactly on load. The moment you move a slider, the value below becomes a single-path what-if at your assumptions (not the three-scenario weighting), which is why it can differ from the headline once you've touched it.
8.5% — beta-based (CAPM), from this stock's BetaBeta — How much the stock moves when the overall market moves. 1.0 = moves with the market; 1.5 = moves 50% more than the market.
Why it matters: Higher beta = more volatile = should demand higher discount rate. Low beta stocks (utilities, consumer staples) move less.
Reference: Most stocks 0.5–1.5 · Defensives ~0.3 · High-vol tech ~1.5–2.0
Full explanation → of 0.47. The safe Treasury rate plus a premium scaled by how much more (or less) volatile the stock is than the market.
9.5% — sector/quality tier. A simpler hurdle set by industry and business durability: lower for stable, wide-moat companies; higher for speculative or micro-caps.
The headline value and this calculator start at 9.5% — the more conservative sector/quality rate (we use the more conservative sector/quality rate when model applicability is limited or the balance sheet is stretched). Drag the slider to the other rate to see the full range.
+282.4%
At the default assumptions the flat path lands near our published value of $213.97. Move any slider to recompute it with your own.
Move any slider above to recompute this against your own assumptions.
⚙ Advanced — tinker with every input (beta, growth, rate path, margin → full intrinsic value)
ARGENX SE is well above the model value; the price is 282.4% above intrinsic valueIntrinsic Value — Our DCF model's estimate of what each share is mathematically worth based on projected cash flows.
Why it matters: Compare to current price. Below IV = potentially undervalued. Above IV = priced for growth that must actually happen.
Reference: Model-derived; quality depends on data and assumptions.
Full explanation → (a 282.4% premium). The market appears to be paying up for the company's potential drug pipeline catalysts and future margin expansion, which are not fully captured by the backward-looking model. The biggest risk that our model's base assumptions prove too high is if the operating cash flow, which was positive in only 1 of the last 5 years, fails to sustain or grow from its latest $685.2 million level.
As of 13 days ago
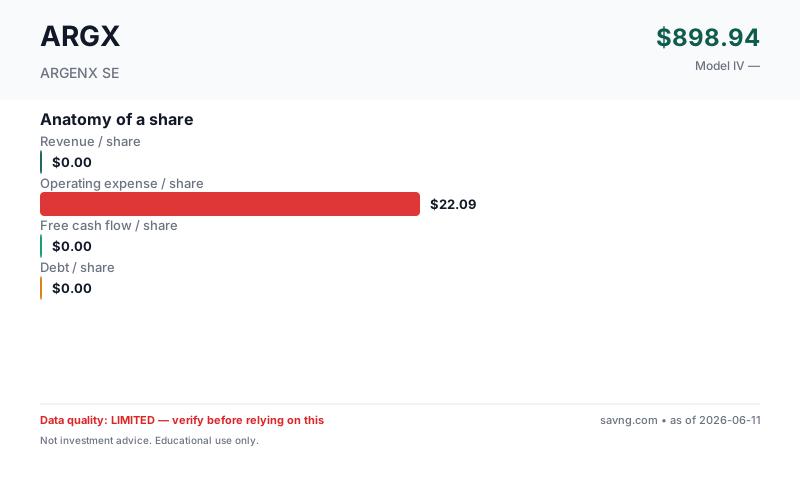
Anatomy of a share
What you're buying per share. Bars are at the same scale so you can see the relative size of revenue, costs, cash flow, and debt — not just read them in a table.
What's free cash flow / what do these mean?
Revenue per share — how much the business earns from customers, divided by the number of shares outstanding. Top of the income statement.
Earnings per share — profit left after operating costs, interest, and taxes, per share. Two versions appear on this page and are not interchangeable: GAAP diluted EPS uses the company's weighted-average diluted share count during the reporting period (this is the "earnings" in "price-to-earnings"); net income per current share divides annual net income by today's share count. They differ whenever the share count has changed.
Owner-earnings free cash flow per share — the cash the business produces for shareholders. Savng's owner-earnings FCF subtracts capital expenditures and stock-based compensation from operating cash flow (SBC is a real dilution cost even though it's non-cash). This is deliberately more conservative than "standard" FCF, which subtracts only capital expenditures — so our figure is lower than the headline FCF you'll see elsewhere. FCF funds dividends, buybacks, debt repayment, and acquisitions; a company can report positive earnings yet negative FCF.
Debt per share — total interest-bearing borrowings divided by shares. High debt-per-share next to thin FCF-per-share is a fragility signal.
What you actually need to decide
Every stock price is a disagreement. Here's the single thing that must go right for the bulls, the single thing that breaks the thesis, and the concrete signposts to watch so you can update your view as real results arrive.
- Next quarter's operating cash flow trend
- Updates on clinical trial progress and regulatory approvals
- Revenue growth from key products
The trend, in plain numbers (FY2024 → FY2025, latest reported)
Straight from the financial statements — no model, no opinion. For a small or unprofitable company, the direction of these numbers usually tells you more than any single valuation.
- Revenue grew +90% to $4.15B.
- Free cash flow turned positive at $430.9M.
- Net income grew +55% to $1.29B.
Nothing was clearly worsening year-over-year.
Management & Leadership
Limited executive data available. The CEO and key executives are not provided in the latest filing data, but public sources indicate Tim Van Hauwermeiren is the CEO. These names are from public sources rather than the latest filing.
What They Make
ARGENX SE is a biotechnology company focused on developing antibody-based therapies for severe autoimmune diseases and cancer. The company generates revenue from product sales and collaborations, with pharmaceutical companies and healthcare systems being the primary payers.
End Markets
Revenue Drivers
Why Is It Priced Like This?
Why Customers Pay
The market prices ARGX at a premium of +282.4% to the model's intrinsic valueIntrinsic Value — Our DCF model's estimate of what each share is mathematically worth based on projected cash flows.
Why it matters: Compare to current price. Below IV = potentially undervalued. Above IV = priced for growth that must actually happen.
Reference: Model-derived; quality depends on data and assumptions.
Full explanation →, likely due to anticipated future growth from its drug pipeline and potential for significant margin expansion. The market may be assigning value to future drug pipeline catalysts, which is not in the model. This optimism is supported by the company's positive net income in the latest fiscal year and an adequate current ratio of 5.23, despite operating cash flow being positive in only 1 of the last 5 years.
Three Scenarios, Weighted
| Scenario | IV | Upside from today's price | Weight |
|---|---|---|---|
| Conservative | $159.81 | -80.5% | 40% |
| Base | $218.15 | -73.3% | 35% |
| Optimistic | $294.78 | -64.0% | 25% |
| Weighted | $213.97 | -73.9% | 100% |
Reading the last column: it is the move from today's price to each value (IV ÷ price − 1). The headline "premium/discount to model IV" measures the same gap from the value's side (price ÷ IV − 1), so the two percentages differ in size and sign by construction — e.g. a price 8% above value is a value 7.4% below price.
Business Model & Valuation
How They Make Money
The company reported $3.5 billion in cash and short-term investments, indicating a strong liquidity position, and funds its operations through product sales and collaborations.
Growth / Revenue DCF Low
Extreme market premium (P/FCF 138x): market is pricing future growth far beyond current FCF. Using revenue/margin model.
▾ Why is DCF applicability "Low" for ARGX?
- The latest single-year FCF sits materially below the normalized figure the model uses, a sign of cyclicality.
- Individual business-segment drivers are not forecast separately — the model works off consolidated cash flow only.
Because of this, we headline the more conservative discount rate and urge you to weight the reverse-DCF, leverage, and operating trends alongside the DCF.
Show advanced inputs
| Revenue Growth | 15.0% |
What this model does NOT do: this is a consolidated owner-earnings cash-flow model. Standalone segment assumptions: none. It does not project product, services and recurring/cloud lines independently; their combined effect is embedded in the historical revenue and cash-flow trend the model extrapolates. The calculator above can only approximate a segment's impact through the single consolidated growth rate — it cannot model any one line separately. For a true segment-level view, build a separate model from the company's segment disclosures.
Maturity & Competitive Position
Moat Signals
Revenue increased to $4.2 billion in the latest fiscal year, while net income was positive at $1.3 billion.
Geography & Markets
Geographic Risks
Market Signals
These are timing signals, not value signals — they describe the stock's recent price behavior, not what the business is worth. Use them for the "the thesis looks good, but is now the moment?" question. Each tile below explains what it's saying.
Why it matters: Short-term contrarian indicator. Extreme readings often precede mean reversion, though not always.
Reference: 30–70 normal · >70 overbought · <30 oversold
Full explanation → (14)44.8NeutralMomentum is balanced — neither overbought nor oversold.
Why it matters: When the fast line crosses above the slow line, short-term momentum is turning up; below, turning down. A timing cue, not a value signal.
Reference: Line above signal = bullish momentum · below = bearish
Full explanation →BearishLine below signalThe fast trend is below the slow trend — short-term momentum is currently downward.
Technicals describe price, not the business. A great company can have a "bearish" tape (a buying chance) and a weak one a "bullish" tape (a trap). Pair these with the valuation and health sections above.
QUALITY
Data Quality & Risk Flags (4 notes — click to expand/collapse)
Guardrail Notes (4)
- Revenue/margin projection model used - trailing FCF may understate growth runway at current scale.
- Price is 4.5x model IV - market may be pricing optionality, narrative catalysts, or margin expansion beyond what trailing cash flows support.
- Price is 3.7x model IV - market may be pricing optionality, narrative catalysts, or margin expansion beyond what trailing cash flows support.
- Extreme valuation gap (P/IV 4.48): result may be dominated by model assumptions, share count issues, or sector-specific dynamics. Treat as low confidence.
FINANCIALS
Financial Statements (5-year tables — click to expand)
From Argenx SE's SEC filings (EDGAR).
Income (5yr)
| Year | Revenue | Net Income | EPS |
|---|---|---|---|
| 2025 | 4.2B | 1.3B | $19.57 |
| 2024 | 2.2B | 833.0M | $12.78 |
| 2023 | 1.2B | -295.1M | $-5.16 |
| 2022 | 400.7M | -709.6M | $-13.05 |
| 2021 | — | -408.3M | $-7.99 |
Cash Flow (5yr)
| Year | Operating CF | CapEx | − SBC | Free Cash Flow |
|---|---|---|---|---|
| 2025 | 685.2M | 6.2M | 248.1M | 430.9M |
| 2024 | -82.7M | 1.8M | 235.2M | -319.7M |
| 2023 | -420.3M | 812,000 | 233.0M | -654.1M |
| 2022 | -862.8M | 837,000 | 157.0M | -1.0B |
| 2021 | -606.8M | 3.6M | 179.4M | -789.8M |
How we define FCF: operating cash flow − capital expenditure − stock-based compensation (owner-earnings basis — SBC is a real cost to shareholders even though it's non-cash). Latest year: 685.2M − 6.2M − 248.1M (stock-based comp) = 430.9M. This is the same owner-earnings FCF definition the valuation model uses, though the DCF's starting value is a projected from revenue × terminal margin, not this single year.
Balance Sheet
| Total Assets | 8.7B |
| Total Liabilities | 1.4B |
| Equity | 7.3B |
Similar companies worth a look
Same sector and industry, similar fundamentals shape. Verify everything yourself — this list is computed mechanically and does not reflect our judgment about whether any of these are a good investment.
The questions people ask about ARGX
Is Argenx SE (ARGX) a good stock to buy?
Argenx SE (ARGX) looks expensive against its own cash flows: the price is about 282% above our $213.97 estimate. Whether it is a good buy depends on whether the company can grow faster than that price assumes, on its financial health, and on what insiders are doing. All three are on this page. This is educational research from SEC filings, not investment advice.
Is Argenx SE (ARGX) overvalued?
Yes, by our measure. Argenx SE (ARGX) trades at $818.30, about 282% above our estimate of $213.97 for what the business is worth. This is educational research from SEC filings, not investment advice.
What is ARGX's intrinsic value?
Our model estimates ARGX is worth about $213.97 per share, built from the cash the business is expected to generate, taken from its SEC filings. The market price is $818.30.
What growth is priced into ARGX?
Working backwards from today's price, the market expects ARGX's cash flow per share to grow by roughly 14.4% a year over the next five years. Compare that with the company's actual record on this page.
Where do these numbers come from?
From Argenx SE's own SEC filings (10-K and 10-Q), Form 4 insider filings and daily market prices. Every figure on the page links to how it was calculated, and the model's weak spots are listed next to its results.