
ASTRAZENECA PLC (AZN) Stock Analysis
ASTRAZENECA PLC
Nothing we have tested argues against it, and one check argues for it.
What each rating means, in numbers
How wild is the price? — Calm. The share price swings about 30% in a typical year, which puts it in the below average. Out of every 100 companies that swung like this, about 0.7 went bankrupt within the year. Across the three periods we tested that ran from 0.0% to 1.6%.
What "tested" means here, and why there is no score out of 100
Tested means the read was measured against what actually happened afterwards, on a history that keeps the companies that were later delisted, using only figures that had been filed on the day they are used. Survival was ranked on companies that really did fail. What an owner keeps was tested across the universe from 2011 to 2025.
The full record of everything we have tested is on the research pages.
Which benchmark. Over the period we tested, the median listed company returned +5.8% a year while the S&P 500 returned about +13.9% — the index is weighted by size and was carried by a handful of enormous winners. So "beats the index" and "beats the other companies you could have bought" are different questions. Where a read says it picks better companies, it means the second one. None of these gets you an index fund's return, and we would rather say that than imply otherwise.
The quality read is the strongest thing we have tested: 131,000 company-quarters across 5,300 companies, where the weakest scorers went on to fail at 5.4% against 1.4% for the strongest, holding in every era and all twelve sectors. It still says less likely to break, not likely to beat the market — every band in that study lost to the index at the median, because the median listed company does.
Each read is shown on its own rather than merged into a single score, so you can see which part is strong and which is weak instead of taking an average on trust.
▾ What goes into the smart-money reading
Contributions (weight × component score) sum to the total. This near-term score now includes fundamental health (leverage, FCF trend, DCF applicability). See the Financial Health section for the full balance-sheet read.
Chance the S&P 500 falls 10% or more in the next three months.
Counted from every day since 2006. Says nothing about AZN — see the board for how it is measured.
📍 Where to start on this page, and what to look at first
How to read AZN
AZN generates real cash flow, but the DCF here is a low-confidence estimate — the value is sensitive to how we normalize cash flow, cyclicality, and secular/industry risk. Treat the DCF as one input, then pressure-test it against the reverse-DCF, leverage, and the operating trends below.
-
1
The verdict + intrinsic value (our DCF) ↓
Our estimate of what a share is worth, versus today's price.
-
2
Reverse-DCF + the interactive calculator ↓
See the growth the price assumes, then flex every assumption yourself to pressure-test it.
-
3
Football field + peers ↓
A cross-check across methods and against comparable companies.
Is now a good time to buy AZN?
Macro: Neutral / mid-cycleAZN trades at $156.90 vs an estimated intrinsic value of $107.14 — a +46.4% premium to model IV.
Not investment advice. The model can be wrong. Verify the assumptions in the sections below and consider consulting a licensed advisor for significant decisions.
What return would AZN pay as a bond?
Not measurable here. Pre-profit: the coupon is projected, not earned. An equity bond needs a coupon that exists today. See the cross-company ranking →
Who expects what from AZN
The price implies one growth rate and our model produces another — and both have been scored against what actually happened. Beside them: how the analysts covering this company rate it, and how accurate their earnings estimates have proved.
What each number is, and which has been tested
Us — 11.9% over 5 years. Tested across 3,279 past filings: a median miss of 4.8 points a year against realised five-year growth, better than both the market and a naive carry-forward.
Analysts (their record here) — Very accurate. Over the last 4 quarters, the consensus earnings estimate for this company missed by a median of 1.5% either way, and ran close to unbiased on average (2 beats, 2 misses). This is NEXT-QUARTER earnings, which companies guide analysts toward - they are supposed to be good at it. It says nothing about long-run growth, which nobody guides.
Analyst data from Finnhub, snapshotted recently. Their forward estimates are behind a paywall we have not bought, so what is shown is their rating and their measured track record on this company — not their forecast. Nothing here is used anywhere in our valuation: feeding an unscored forecast into the model would undo the one growth result we have actually tested.
What growth must the market believe? Reverse DCF — Instead of asking "what is this stock worth?", asks "what growth rate is the current market price already assuming?"
Why it matters: It crystallizes the bull thesis as a single number you can argue with. If the market expects 40% growth for 10 years and you do not believe that, the stock is overvalued.
Reference: 10–15% = sustainable for strong companies · 20–25% = exceptional · 30%+ = historically very rare
Traditional DCF asks "what is this stock worth?" Reverse DCF flips it: it treats today's price as correct and solves for the growth rate that justifies it. In plain terms — if our model is right about everything else, the company's cash flow would have to grow (or shrink) by this much every year for the next 5 years for today's price to make sense. If that required growth looks unrealistic, the price is stretched; if it looks easy to beat, the price may be cheap.
Why it matters: A company can show big profits on paper while burning through cash. FCF is what actually fills the bank account.
Reference: Healthy mature businesses convert 8–15% of revenue into FCF · Growth companies often negative
Full explanation → must grow at:
▾ Exactly how this 5-year figure is computed
Forecast length: 5 years at the solved rate, then a linear fade to terminal growth over years 6-10 — the same shape the DCF above uses
Terminal growth after the fade: 3.0%
Discount rate: 9.0% (the rate the model used)
Price used: $156.90 — the live price shown on this page (not frozen)
Method: solve for the constant annual growth rate that makes the discounted 10-year FCF stream + terminal value equal today's price.
The market is pricing in shrinking cash flow — often a sign of undervaluation, and sometimes of a dying business. Check leverage, the cash-flow trend and the health screens below to tell those apart.
For reference: The market is pricing in flat-to-slightly-declining cash flow — common for mature or out-of-favor companies, not a vote of confidence.
▾ How we computed this · Reality check thresholds · Assumptions
- Starting FCF/share: $10.95 (projected from revenue × terminal margin)
- Discount RateDiscount Rate — The annual return you demand for taking single-stock risk instead of buying a safe Treasury or index fund.
Why it matters: Higher discount rate = stricter valuation (a stock has to produce more cash to be worth holding). Lower = more generous.
Reference: 8–12% is standard · 9–10% matches S&P 500 historical return · Below 7% is illogical for single-stock risk
Full explanation →: 9.0% — standard 8-12%; 9-10% matches S&P 500 historical return - Terminal Growth RateTerminal Growth Rate — The growth rate we assume the company holds forever, after the explicit 10-year forecast period ends.
Why it matters: It anchors the long-tail value. Cannot mathematically exceed long-term GDP growth or the company eventually becomes larger than the global economy.
Reference: 2–3% (matches long-term US GDP growth) · Above 4% is mathematically problematic
Full explanation →: 3.0% — matches long-term GDP growth - Forecast horizon: 10 years explicit + terminal perpetuity
| ≤ 0% | Priced for decline — likely undervalued OR dying business |
| 5-12% | Reasonable; sustainable for quality businesses |
| 12-18% | Demanding — strong execution required |
| 18-25% | Exceptional — few companies sustain for a decade |
| 25-35% | Heroic — historically very rare |
| 35%+ | Borderline impossible at scale |
Sustaining 30%+ cash-flow growth for a full decade at scale is exceedingly rare — the bar is brutally high.
Use the interactive calculator below to change the discount rate, growth and terminal-growth assumptions and watch the value move.
What this rating means
What the rating says — Methods disagree. Methods disagree: the price is ABOVE 1 of 3 method ranges while inside the rest — assumption-sensitive, not clearly fair.
What it does not say — Not a forecast. This shows where today's price sits against several different ways of valuing the business. Where the methods disagree, the spread itself is the useful part - it tells you how much the answer depends on which one you trust.
Football field: where does the price sit?
Different valuation methods produce different fair-value ranges depending on assumptions. Plotting them together lets you see at a glance whether the current price is reasonable across approaches, or only one specific lens.
Industry multiples sourced from: industry: Pharmaceuticals. See the Peer Basket section below for the peer comparison and its limited-comparables caveat.
Bankruptcy + quality screens
Cheap stocks can be cheap for a reason. These screens warn when a low valuation comes paired with structural fragility.
What these health ratings mean, in numbers
Bankruptcy score (Altman Z) — Safe. Altman Z is 3.28. It combines working capital, retained earnings, operating profit and market value against total assets into one bankruptcy score. Above 3.0 is the safe zone, 1.8 to 3.0 is grey, below 1.8 is the distress zone. It was calibrated on manufacturers in 1968, so it reads asset-light and heavily-financed businesses badly — which is why it is one input here and never the verdict.
Why it matters: Cheap-looking stocks (low P/E or P/B) often have low Z-scores because the market knows the company is dying. Z-score warns you before you fall into a value trap.
Reference: > 3.0 = safe zone · 1.81–3.0 = grey zone · < 1.81 = distress zone
Full explanation →
Safe zone under the classic Altman thresholds — companies scoring here have historically gone bankrupt only rarely within ~2 years. A screening signal, not a guarantee.
The classic Z-score was calibrated on manufacturers. It is less reliable for asset-light or non-manufacturing businesses (broadcasters, media, software, services) and not applicable to banks, REITs, or insurers — for those the coefficients and the asset-turnover term distort the result. Read it as one screening input, not a verdict.
Why it matters: High score = fundamentals improving. Low score = deteriorating. Especially powerful for filtering cheap stocks: cheap + high F-score historically outperforms; cheap + low F-score is often a value trap.
Reference: 7–9 = strong · 4–6 = mediocre · 0–3 = weak
Full explanation →
The F-score compares two consecutive years of income, cash-flow and balance-sheet data. We have 5 years of income data for this filer, but no machine-readable cash-flow statement — so several of the nine checks have no input at all. We show nothing rather than score a partial year against itself. The reported figures in the financial tables below are unaffected.
What if you assume different inputs?
Here's where we land — and what happens if you change the assumptions. Drag the sliders to set your own Discount RateDiscount Rate — The annual return you demand for taking single-stock risk instead of buying a safe Treasury or index fund.
Why it matters: Higher discount rate = stricter valuation (a stock has to produce more cash to be worth holding). Lower = more generous.
Reference: 8–12% is standard · 9–10% matches S&P 500 historical return · Below 7% is illogical for single-stock risk
Full explanation → (the annual return you demand for single-stock risk) and terminal growth; the value updates live so you can see whether the stock looks cheaper or richer. The discount rate starts at 9.0%, the figure our model used for AZN. Open Advanced to also change beta, growth and the rate path.
Note: the calculator opens at our published value of $107.14 — it is initialised to the same scenario-weighted result, so the two match exactly on load. The moment you move a slider, the value below becomes a single-path what-if at your assumptions (not the three-scenario weighting), which is why it can differ from the headline once you've touched it.
8.5% — beta-based (CAPM), from this stock's BetaBeta — How much the stock moves when the overall market moves. 1.0 = moves with the market; 1.5 = moves 50% more than the market.
Why it matters: Higher beta = more volatile = should demand higher discount rate. Low beta stocks (utilities, consumer staples) move less.
Reference: Most stocks 0.5–1.5 · Defensives ~0.3 · High-vol tech ~1.5–2.0
Full explanation → of 0.45. The safe Treasury rate plus a premium scaled by how much more (or less) volatile the stock is than the market.
9.0% — sector/quality tier. A simpler hurdle set by industry and business durability: lower for stable, wide-moat companies; higher for speculative or micro-caps.
The headline value and this calculator start at 9.0% — the more conservative sector/quality rate (we use the more conservative sector/quality rate when model applicability is limited or the balance sheet is stretched). Drag the slider to the other rate to see the full range.
+46.4%
At the default assumptions the flat path lands near our published value of $107.14. Move any slider to recompute it with your own.
Move any slider above to recompute this against your own assumptions.
⚙ Advanced — tinker with every input (beta, growth, rate path, margin → full intrinsic value)
AstraZeneca PLC is well above the model value; the price is 46.4% above intrinsic valueIntrinsic Value — Our DCF model's estimate of what each share is mathematically worth based on projected cash flows.
Why it matters: Compare to current price. Below IV = potentially undervalued. Above IV = priced for growth that must actually happen.
Reference: Model-derived; quality depends on data and assumptions.
Full explanation → (a 55.5% premium). The market appears to be paying up for its expanding gross margins and consistent revenue growth, which are positive health signals. The biggest risk to our model's base assumptions proving too high is if the current ratio, which is BELOW 1 at 0.94, indicates future liquidity issues that could hinder the projected 11.9% revenue growth.
As of 6 days ago
Anatomy of a share
What you're buying per share. Bars are at the same scale so you can see the relative size of revenue, costs, cash flow, and debt — not just read them in a table.
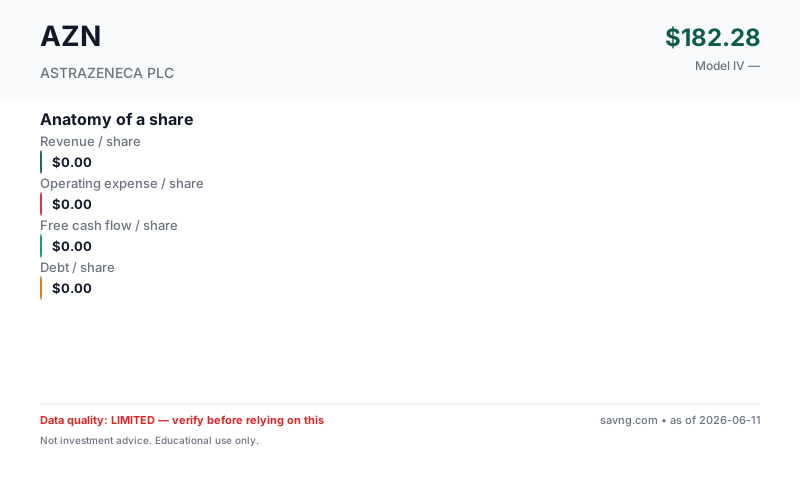
What's free cash flow / what do these mean?
Revenue per share — how much the business earns from customers, divided by the number of shares outstanding. Top of the income statement.
Earnings per share — profit left after operating costs, interest, and taxes, per share. Two versions appear on this page and are not interchangeable: GAAP diluted EPS uses the company's weighted-average diluted share count during the reporting period (this is the "earnings" in "price-to-earnings"); net income per current share divides annual net income by today's share count. They differ whenever the share count has changed.
Owner-earnings free cash flow per share — the cash the business produces for shareholders. Savng's owner-earnings FCF subtracts capital expenditures and stock-based compensation from operating cash flow (SBC is a real dilution cost even though it's non-cash). This is deliberately more conservative than "standard" FCF, which subtracts only capital expenditures — so our figure is lower than the headline FCF you'll see elsewhere. FCF funds dividends, buybacks, debt repayment, and acquisitions; a company can report positive earnings yet negative FCF.
Debt per share — total interest-bearing borrowings divided by shares. High debt-per-share next to thin FCF-per-share is a fragility signal.
What you actually need to decide
Every stock price is a disagreement. Here's the single thing that must go right for the bulls, the single thing that breaks the thesis, and the concrete signposts to watch so you can update your view as real results arrive.
- Next quarter's revenue growth rate
- Changes in gross margin percentage
- Improvements in the current ratio
The trend, in plain numbers (FY2024 → FY2025, latest reported)
Straight from the financial statements — no model, no opinion. For a small or unprofitable company, the direction of these numbers usually tells you more than any single valuation.
- Revenue grew +9% to $58.74B.
- Gross margin improved to 82% (+1 pts).
- Net income grew +45% to $10.23B.
Nothing was clearly worsening year-over-year.
Management & Leadership
Mani Sharma is listed as an officer, though their specific role beyond 'See Remarks' is not detailed in the provided filings. The company's leadership structure, as per the filings, does not explicitly name a Chief Executive or Chief Financial Officer among the listed officers. The market may be assigning value to potential pipeline breakthroughs in oncology or rare diseases, which are not in the model.
See Remarks
What They Make
AstraZeneca PLC is a global pharmaceutical company focused on the discovery, development, manufacturing, and commercialization of prescription medicines. Its primary customers are healthcare providers, hospitals, and government health systems who pay for its pharmaceutical products.
End Markets
Revenue Drivers
Why Is It Priced Like This?
Why Customers Pay
The market prices AZN at a premium of +55.5% to the model's intrinsic valueIntrinsic Value — Our DCF model's estimate of what each share is mathematically worth based on projected cash flows.
Why it matters: Compare to current price. Below IV = potentially undervalued. Above IV = priced for growth that must actually happen.
Reference: Model-derived; quality depends on data and assumptions.
Full explanation →, likely due to its consistent revenue growth of 11.9% annually over four years and expanding gross margins from 66.8% to 81.9%. These health signals suggest the market anticipates continued strong operational performance and profitability, justifying the higher valuation despite the current ratio being below 1.
Three Scenarios, Weighted
| Scenario | IV | Upside from today's price | Weight |
|---|---|---|---|
| Conservative | $81.27 | -48.2% | 40% |
| Base | $109.47 | -30.2% | 35% |
| Optimistic | $145.28 | -7.4% | 25% |
| Weighted | $107.14 | -31.7% | 100% |
Reading the last column: it is the move from today's price to each value (IV ÷ price − 1). The headline "premium/discount to model IV" measures the same gap from the value's side (price ÷ IV − 1), so the two percentages differ in size and sign by construction — e.g. a price 8% above value is a value 7.4% below price.
Business Model & Valuation
How They Make Money
Long-term debt is falling from $27.8 billion to $24.7B, indicating a focus on debt reduction, while the company maintains positive net income.
Growth / Revenue DCF Low
No cash flow statement data available - using revenue/margin growth model as fallback.
▾ Why is DCF applicability "Low" for AZN?
- Individual business-segment drivers are not forecast separately — the model works off consolidated cash flow only.
Because of this, we headline the more conservative discount rate and urge you to weight the reverse-DCF, leverage, and operating trends alongside the DCF.
Show advanced inputs
| Revenue Growth | 11.9% |
What this model does NOT do: this is a consolidated owner-earnings FCF model. Standalone segment assumptions: none. It does not project its revenue segments independently; their combined effect is embedded in the historical revenue and cash-flow trend the model extrapolates. The calculator above can only approximate a segment's impact through the single consolidated growth rate — it cannot model any one line separately. For a true segment-level view, build a separate model from the company's segment disclosures.
Maturity & Competitive Position
Moat Signals
Revenue has been growing at 11.9% per year over the last four years, from $37.4B to $58.7 billion.
Geography & Markets
AstraZeneca is a global pharmaceutical company with operations spanning various continents. Specific geographic revenue mix percentages are not available from current data sources.
Geographic Risks
Market Signals
These are timing signals, not value signals — they describe the stock's recent price behavior, not what the business is worth. Use them for the "the thesis looks good, but is now the moment?" question. Each tile below explains what it's saying.
Why it matters: Short-term contrarian indicator. Extreme readings often precede mean reversion, though not always.
Reference: 30–70 normal · >70 overbought · <30 oversold
Full explanation → (14)54.2NeutralMomentum is balanced — neither overbought nor oversold.
Why it matters: When the fast line crosses above the slow line, short-term momentum is turning up; below, turning down. A timing cue, not a value signal.
Reference: Line above signal = bullish momentum · below = bearish
Full explanation →BullishLine above signalThe fast trend is above the slow trend — short-term momentum is currently upward.
Technicals describe price, not the business. A great company can have a "bearish" tape (a buying chance) and a weak one a "bullish" tape (a trap). Pair these with the valuation and health sections above.
QUALITY
Data Quality & Risk Flags (1 notes — click to expand/collapse)
Guardrail Notes (1)
- FCF negative: revenue/margin growth model projects future cash flows from revenue trajectory.
FINANCIALS
Financial Statements (5-year tables — click to expand)
From ASTRAZENECA PLC's SEC filings (EDGAR).
Income (5yr)
| Year | Revenue | Net Income | EPS |
|---|---|---|---|
| 2025 | 58.7B | 10.2B | $6.54 |
| 2024 | 54.1B | 7.0B | $4.50 |
| 2023 | 45.8B | 6.0B | $3.81 |
| 2022 | 44.4B | 3.3B | $2.11 |
| 2021 | 37.4B | 115.0M | $0.08 |
Balance Sheet
| Total Assets | 114.1B |
| Total Liabilities | 65.4B |
| Equity | 48.7B |
| Total Debt | 27.8B |
Similar companies worth a look
Same sector and industry, similar fundamentals shape. Verify everything yourself — this list is computed mechanically and does not reflect our judgment about whether any of these are a good investment.