
HSBC HOLDINGS PLC (HSBC) Stock Analysis
HSBC HOLDINGS PLC
▾ What's in the 46/100 risk score? (higher = riskier)
Contributions (weight × component score) sum to the total. This near-term score now includes fundamental health (leverage, FCF trend). See the Financial Health section for the full balance-sheet read.
How to read HSBC (bank / insurer)
Banks and insurers are valued on what they earn on their capital, not on free cash flow — a normal DCF misleads here.
-
1
Bank / Insurance lens (P/TBV + ROE) ↓
Price-to-tangible-book versus return-on-equity is how analysts actually judge a bank cheap or rich.
-
2
Financial-health screens ↓
Watch the trend in profitability and asset quality, not the (not-applicable) bankruptcy score.
Standard DCF doesn't fit HSBC well — but that's expected for this kind of business. The Bank / Insurance Valuation Lens below uses the metrics actually used by analysts who value banks. Reverse DCF + Football Field also work as cross-checks.
Quality & solvency checks
Cheap stocks can be cheap for a reason. These screens warn when a low valuation comes paired with structural fragility.
Why it matters: Cheap-looking stocks (low P/E or P/B) often have low Z-scores because the market knows the company is dying. Z-score warns you before you fall into a value trap.
Reference: > 3.0 = safe zone · 1.81–3.0 = grey zone · < 1.81 = distress zone
Full explanation →
Altman Z was calibrated on industrial firms and doesn't apply to banks or insurers — their balance sheets are dominated by loans/securities, not working capital. See the Bank Valuation Lens above for P/B, ROE and ROA — the metrics regulators and analysts actually use to assess bank solvency.
Why it matters: High score = fundamentals improving. Low score = deteriorating. Especially powerful for filtering cheap stocks: cheap + high F-score historically outperforms; cheap + low F-score is often a value trap.
Reference: 7–9 = strong · 4–6 = mediocre · 0–3 = weak
Full explanation →
Piotroski F was built for non-financial firms (gross margin, asset turnover, current ratio all assume an industrial cost structure). For banks, the equivalent quality signals are efficiency ratio, net interest margin, and provision coverage — see the Bank Valuation Lens above.
A standard discounted cash flowDCF — Discounted Cash Flow — sums up all future cash a business will produce, adjusted for the fact that future dollars are worth less than dollars today.
Why it matters: It is the most fundamentally honest valuation method when applicable — but only works for companies with predictable, positive cash flow.
Reference: Best for: mature, profitable businesses. Fails for: pre-profit growth, banks, REITs.
Full explanation → valuation is not meaningful for HSBC due to the nature of financial institutions, which often exhibit erratic or negative free cash flowFree Cash Flow (FCF) — Operating cash flow minus capital spending: cash left after a company covers operating costs, taxes and interest and reinvests in the business — but BEFORE repaying debt principal or paying dividends. The cash actually available to investors.
Why it matters: A company can show big profits on paper while burning through cash. FCF is what actually fills the bank account.
Reference: Healthy mature businesses convert 8–15% of revenue into FCF · Growth companies often negative
Full explanation →, making traditional FCF models unsuitable. The residual income model, used here, implies no positive equity value under its assumptions, indicating a speculative or low-confidence valuation. Investors are likely focused on the bank's consistent profitability and its global reach. The biggest risk to our assumptions is the low franchise/durability score of 0/5, suggesting a lack of sustainable competitive advantages that could support long-term excess earnings.
As of 53 days ago
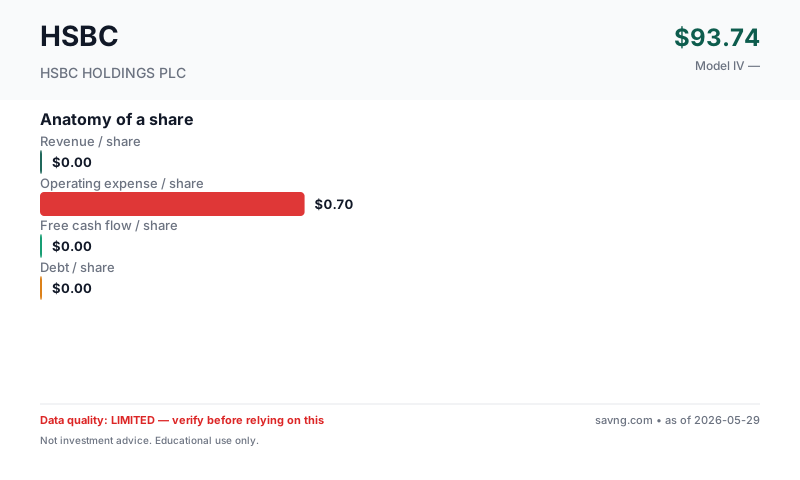
Anatomy of a share
What you're buying per share. Bars are at the same scale so you can see the relative size of revenue, costs, cash flow, and debt — not just read them in a table.
What's free cash flow / what do these mean?
Revenue per share — how much the business earns from customers, divided by the number of shares outstanding. Top of the income statement.
Earnings per share — profit left after operating costs, interest, and taxes, per share. Two versions appear on this page and are not interchangeable: GAAP diluted EPS uses the company's weighted-average diluted share count during the reporting period (this is the "earnings" in "price-to-earnings"); net income per current share divides annual net income by today's share count. They differ whenever the share count has changed.
Owner-earnings free cash flow per share — the cash the business produces for shareholders. Savng's owner-earnings FCF subtracts capital expenditures and stock-based compensation from operating cash flow (SBC is a real dilution cost even though it's non-cash). This is deliberately more conservative than "standard" FCF, which subtracts only capital expenditures — so our figure is lower than the headline FCF you'll see elsewhere. FCF funds dividends, buybacks, debt repayment, and acquisitions; a company can report positive earnings yet negative FCF.
Debt per share — total interest-bearing borrowings divided by shares. High debt-per-share next to thin FCF-per-share is a fragility signal.
What you actually need to decide
Every stock price is a disagreement. Here's the single thing that must go right for the bulls, the single thing that breaks the thesis, and the concrete signposts to watch so you can update your view as real results arrive.
- Changes in net interest margin
- Growth in wealth management assets
- Trends in non-performing loans
The trend, in plain numbers (FY2024 → FY2025, latest reported)
Straight from the financial statements — no model, no opinion. For a small or unprofitable company, the direction of these numbers usually tells you more than any single valuation.
- Net income fell -7% to $23.13B.
Nothing was clearly improving year-over-year.
Management & Leadership
Noel Quinn has served as the Group Chief Executive of HSBC since March 2020, overseeing the bank's global operations and strategic direction. Mark Tucker is the Group Chairman, providing leadership to the board.
What They Make
HSBC Holdings PLC is a global banking and financial services organization that provides a wide range of services including retail banking, wealth management, commercial banking, and global banking and markets. Its paying customers are individuals, businesses, and institutional clients who utilize these financial products and services.
End Markets
Revenue Drivers
Why Is It Priced Like This?
Why Customers Pay
What we use instead: earnings (P/E, EV/EBIT), book value & return on equity (P/TBV + ROE — how banks are actually judged) — computed from the figures this company does report, shown in the sections below. Those numbers are unaffected by the missing cash-flow data.
The market's pricing for HSBC is driven by its consistent profitability, having been profitable for 5 out of 5 years, which suggests a stable underlying business. Despite this, the model's indication of no positive equity value under its assumptions highlights that the market may be valuing the company based on its book value and future earnings potential rather than a clear cash flow trajectory, especially given the low franchise/durability score of 0/5.
Business Model & Valuation
How They Make Money
Residual Income
Balance-sheet financial (Banks): residual income model - book value is meaningful anchor.
Show advanced inputs
| Sector Default | 8.0% |
What this model does NOT do: this is a consolidated owner-earnings FCF model. Standalone segment assumptions: none. It does not project net interest income and fee-income lines independently; their combined effect is embedded in the historical revenue and cash-flow trend the model extrapolates. The calculator above can only approximate a segment's impact through the single consolidated growth rate — it cannot model any one line separately. For a true segment-level view, build a separate model from the company's segment disclosures.
Maturity & Competitive Position
Moat Signals
Net income has been positive for the latest period and for 5 out of 5 years.
Geography & Markets
HSBC operates globally, with a significant presence across Asia, Europe, the Middle East, North America, and Latin America. While specific geographic mix percentages are not available in the current data, Asia typically represents a substantial portion of its revenue and profit.
Geographic Risks
Market Signals
These are timing signals, not value signals — they describe the stock's recent price behavior, not what the business is worth. Use them for the "the thesis looks good, but is now the moment?" question. Each tile below explains what it's saying.
Why it matters: Short-term contrarian indicator. Extreme readings often precede mean reversion, though not always.
Reference: 30–70 normal · >70 overbought · <30 oversold
Full explanation → (14)65.5NeutralMomentum is balanced — neither overbought nor oversold.
Why it matters: When the fast line crosses above the slow line, short-term momentum is turning up; below, turning down. A timing cue, not a value signal.
Reference: Line above signal = bullish momentum · below = bearish
Full explanation →BullishLine above signalThe fast trend is above the slow trend — short-term momentum is currently upward.
Technicals describe price, not the business. A great company can have a "bearish" tape (a buying chance) and a weak one a "bullish" tape (a trap). Pair these with the valuation and health sections above.
QUALITY
Data Quality & Risk Flags (6 notes — click to expand/collapse)
Guardrail Notes (6)
- Financial sector: using residual income model. IV = Book Value + PV(excess earnings).
- INVARIANT: weighted IV is non-positive. Model may not be appropriate.
- Model implies no positive equity value under these assumptions. Valuation is speculative/low-confidence.
- Model mismatch: residual income inappropriate for asset-light financial (BVPS $0.00 not meaningful vs price $103). Consider FCF model.
- VALUATION HELD (MODEL_MISMATCH): per-share values suppressed due to the assigned valuation model does not fit this business.
- Extreme valuation gap (P/IV withheld — see the note above): result may be dominated by model assumptions, share count issues, or sector-specific dynamics. Treat as low confidence.
FINANCIALS
Financial Statements (5-year tables — click to expand)
From HSBC HOLDINGS PLC's SEC filings (EDGAR).
Income (5yr)
| Year | Revenue | Net Income | EPS |
|---|---|---|---|
| 2025 | — | 23.1B | $1.35 |
| 2024 | — | 25.0B | $1.46 |
| 2023 | — | 24.6B | $1.43 |
| 2022 | — | 16.2B | $0.95 |
| 2021 | — | 14.7B | $0.86 |
Balance Sheet
| Total Assets | 3.2T |
| Total Liabilities | 3.0T |
| Equity | — |
Similar companies worth a look
Same sector and industry, similar fundamentals shape. Verify everything yourself — this list is computed mechanically and does not reflect our judgment about whether any of these are a good investment.